
After approximately 3 months, I have collected wuite a book full of data. It's only use: to serve as a catalyst in the process of getting a grade. I kept a steady journal of my progress throughout the months, and I made sure to write down every thoght I had about the project. In all, there are about 55 entries over the course over 6 months, each one containing information that supported, and helped build this web site, my poster board, and my actual experiment. Now to the final recolection of data, and the important figures.
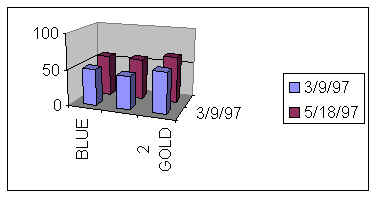
over the course of 3 months, the 2 sets of 3 plants grew in the following ways:
| Plant | Size |
 |
50.5-58cm +7.5cm |
 |
46-56.5cm +10.5cm |
| 57-64cm +7cm | |
 |
|
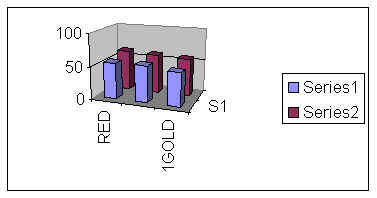
| Plant | Size |
 |
55.5-62.5cm +7cm |
 |
56-59.5 +3.5cm |
| 51-57.5cm +6.5cm | |
 |
|
But besides the size increase, the plants overall color in the plants that resided in my backyard looked, felt, and basically were more healthy. Even though the plants that I chose are one of the BEST rodeside surviving plants. This just goes to show that cars do not help plants, but rather hinder them. This also shows that no matter the plant, everygreen plant is affected by the gas level of the area.
All HTML, Art,
Visual effects, and source code were made by:
Chris Parmelee All
Rights reserved. copyright 1997-1999